One line gets you this.
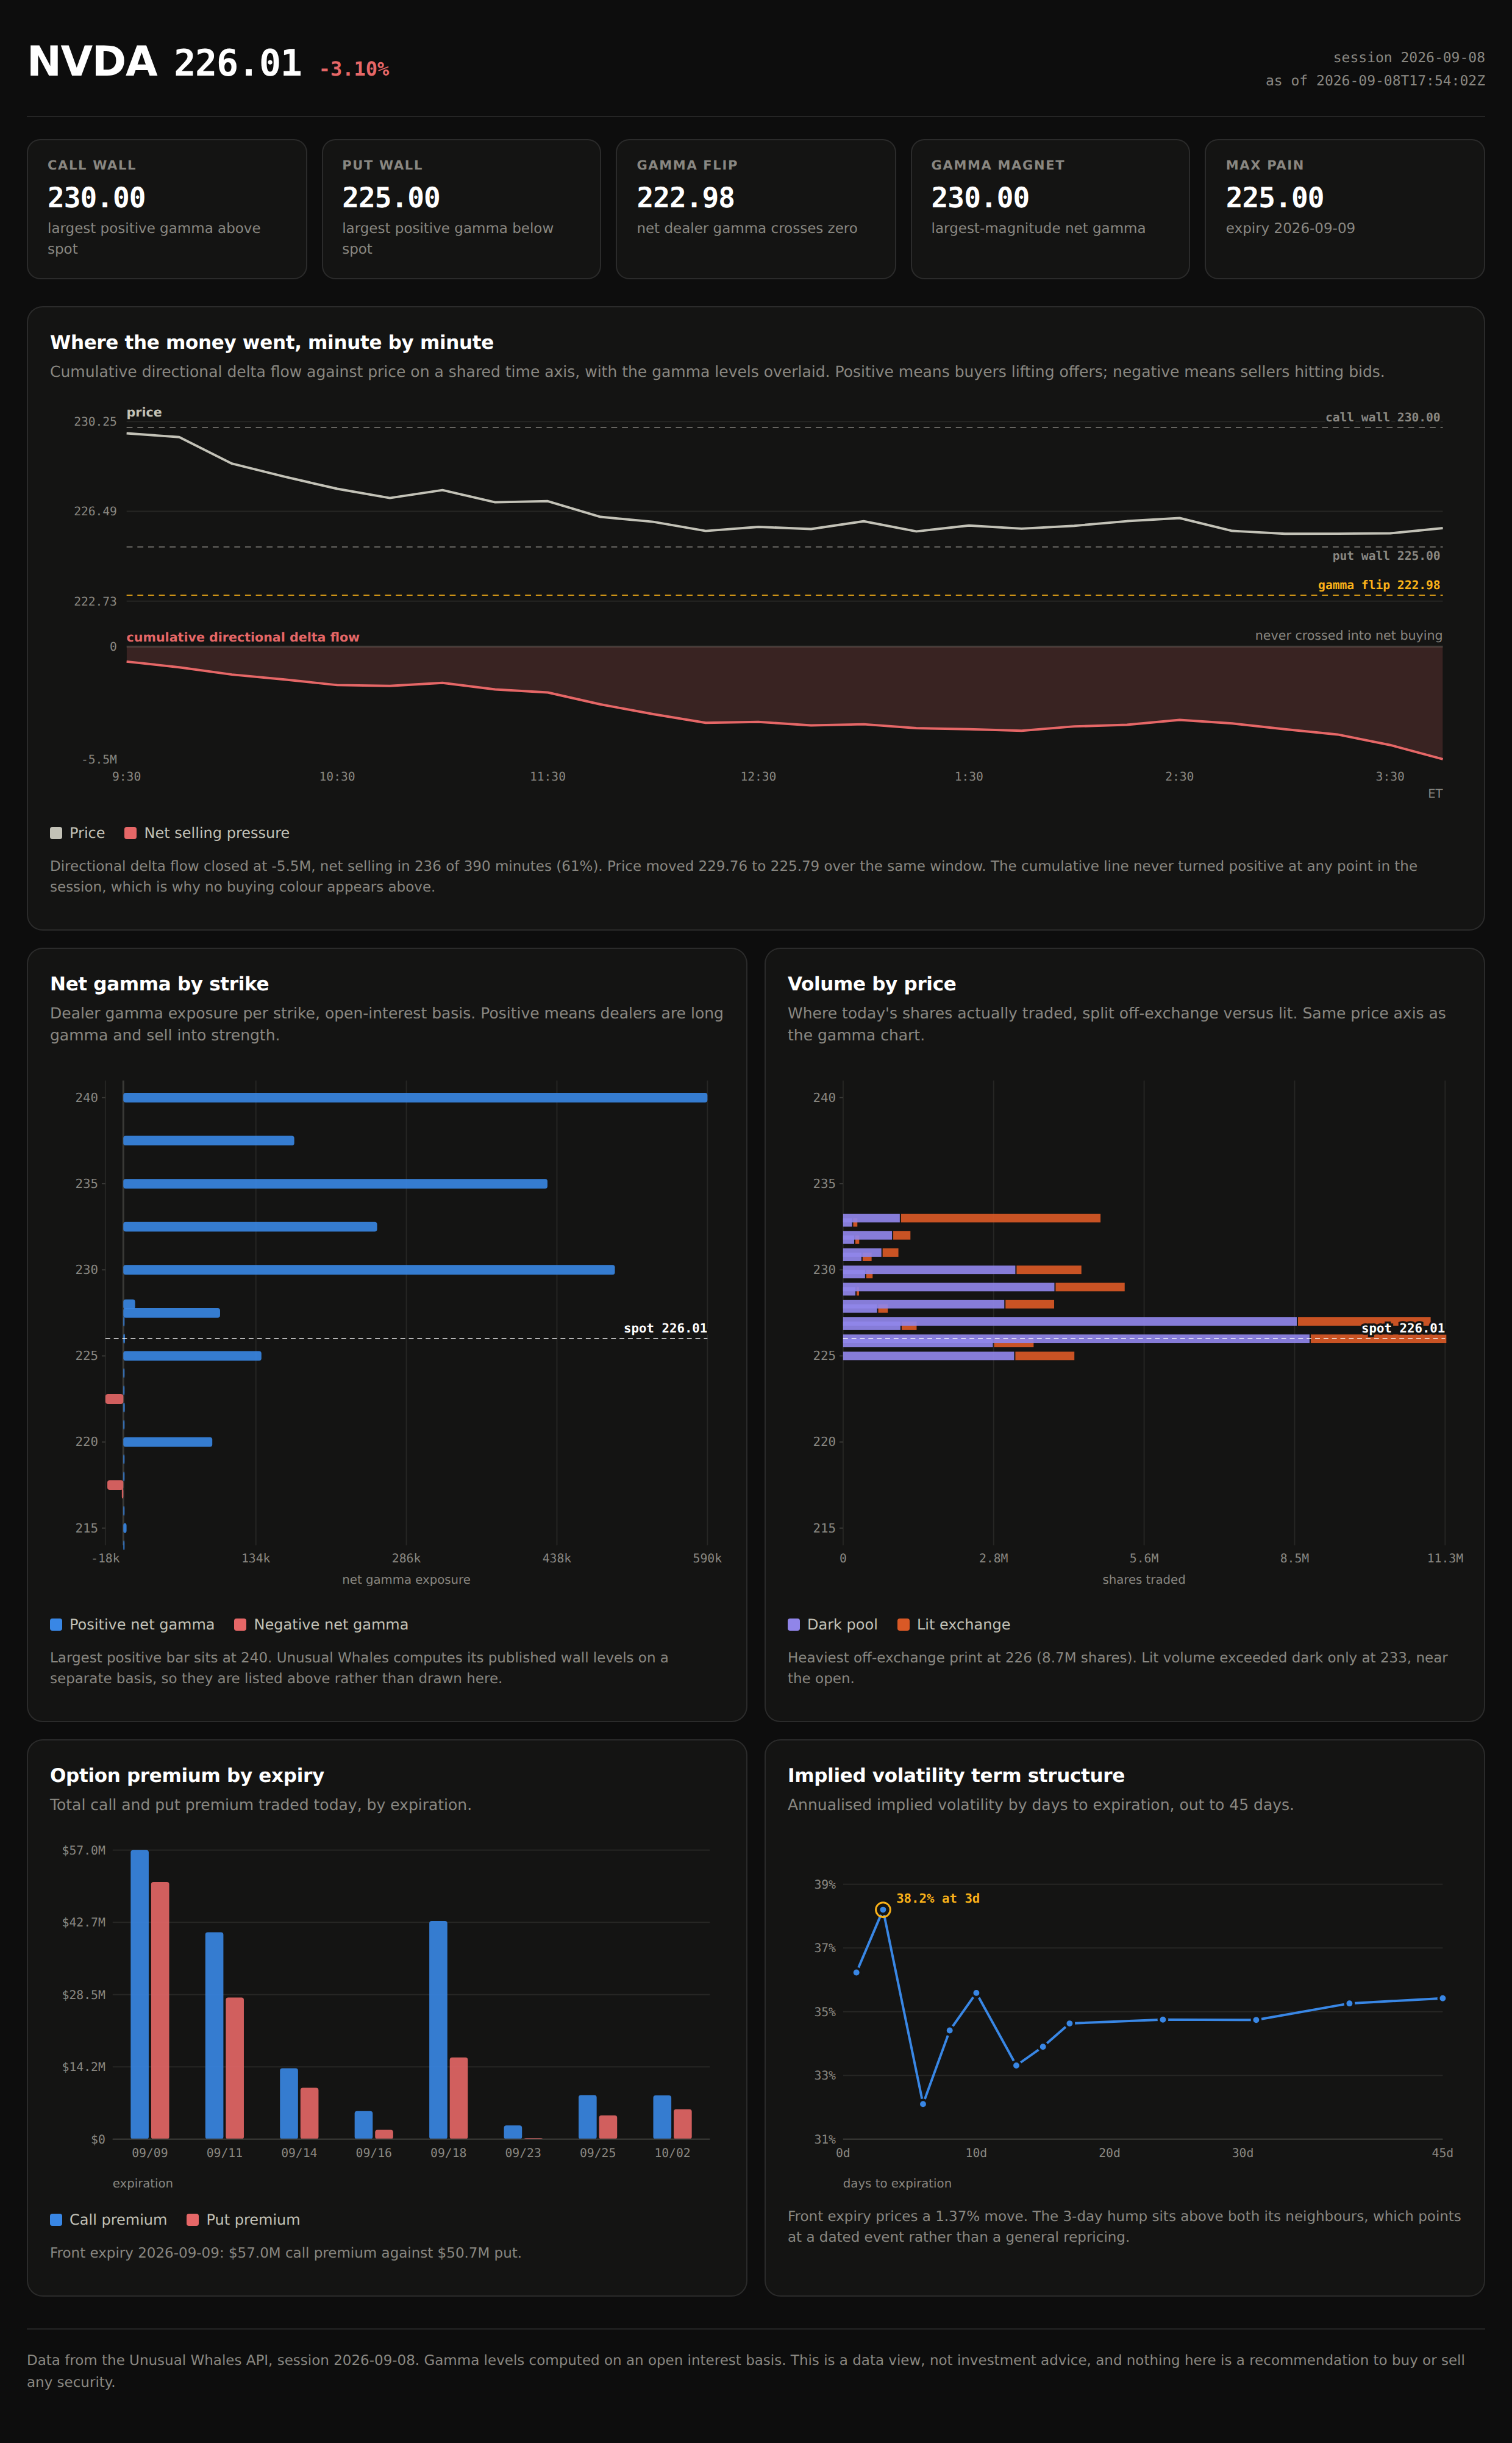
Connect Unusual Whales to Claude, give it a folder, and paste a single line naming the company you care about. Ten minutes later you have the page shown here: dealer gamma, dark pool volume, option premium, implied volatility, and the day's buying and selling pressure minute by minute.
Before it builds anything, Claude asks which parts of the picture you want. The page shown here is a four-subject build. Pick two and you get two.
Three one-time steps, then one line of typing.
There is no code to write, no Python to install and no key to save anywhere on your machine. The first three steps you do once and never again. Step four is the only part you repeat.
- Time
- About 10 minutesEight of them Claude working
- You need
- Claude and an API keyDesktop app, Cowork task
- Makes
- One HTML fileOpens offline, panels you picked
- 1
Connect Unusual Whales
once, everThis link opens the right screen. Click Add in the top right, then Add custom connector, and paste the address below with your own key from unusualwhales.com/dashboard/api in place of the placeholder.
Open Connectors in ClaudeConnector URLhttps://api.unusualwhales.com/api/mcp?token=YOUR_API_KEY
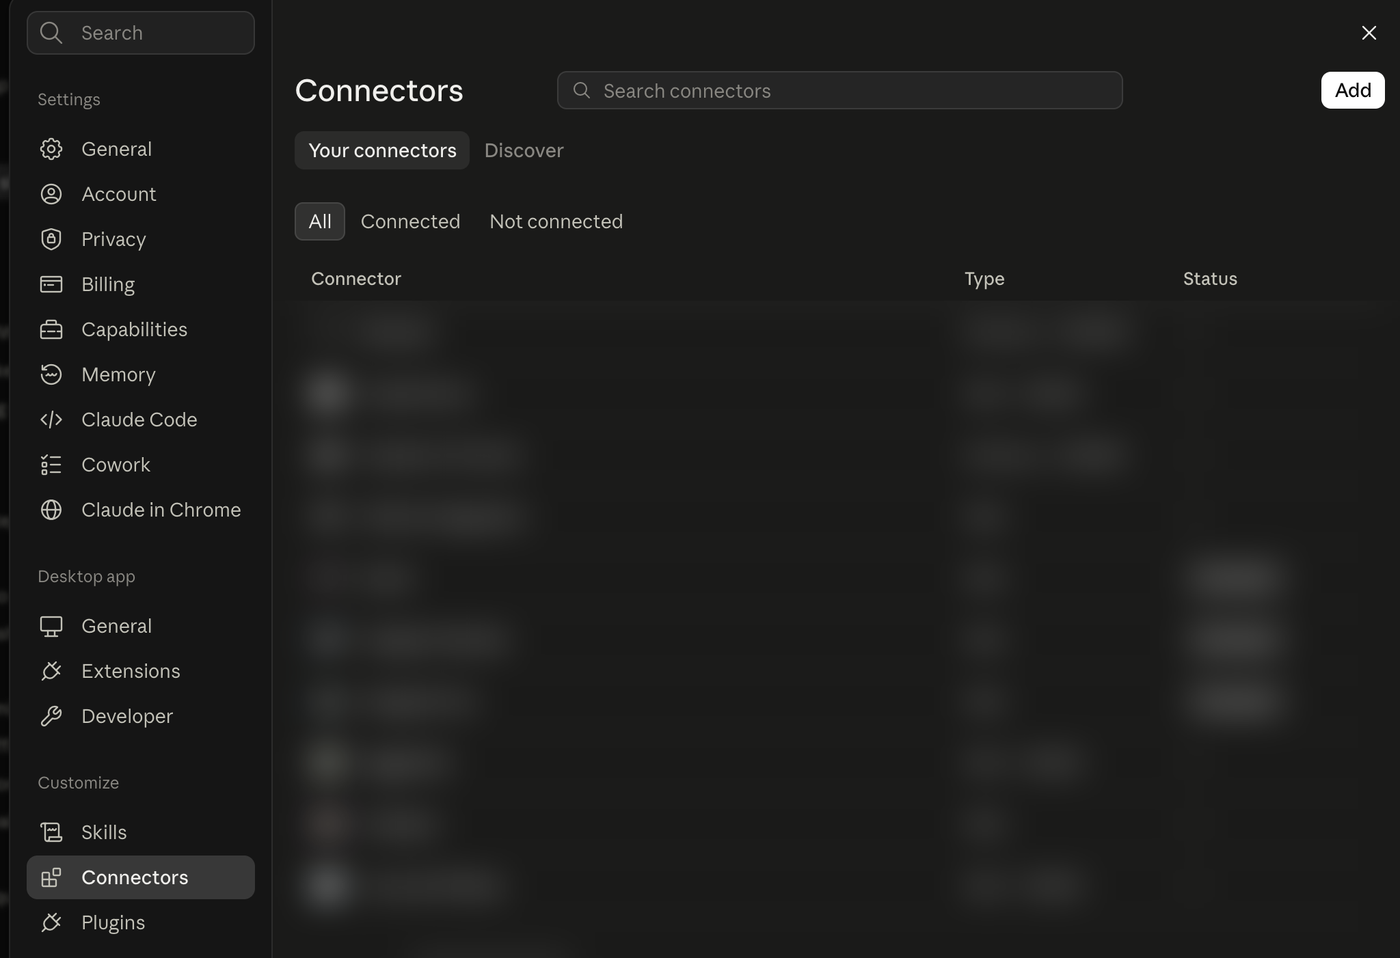
Connectors lives under Customize, not Settings. The Add button is top right. Your key is inside that address, so the whole string is a password. It goes in that box and nowhere else. Not into a chat message, a screenshot or a repo. Prefer a video? Our setup page has a short one.
- 2
Say yes once instead of fifty times
once, everDo this while you are still on that screen, or Claude asks your permission for every single call. Click the Unusual Whales connector you just added, scroll to Tool permissions, and set it to Always allow.
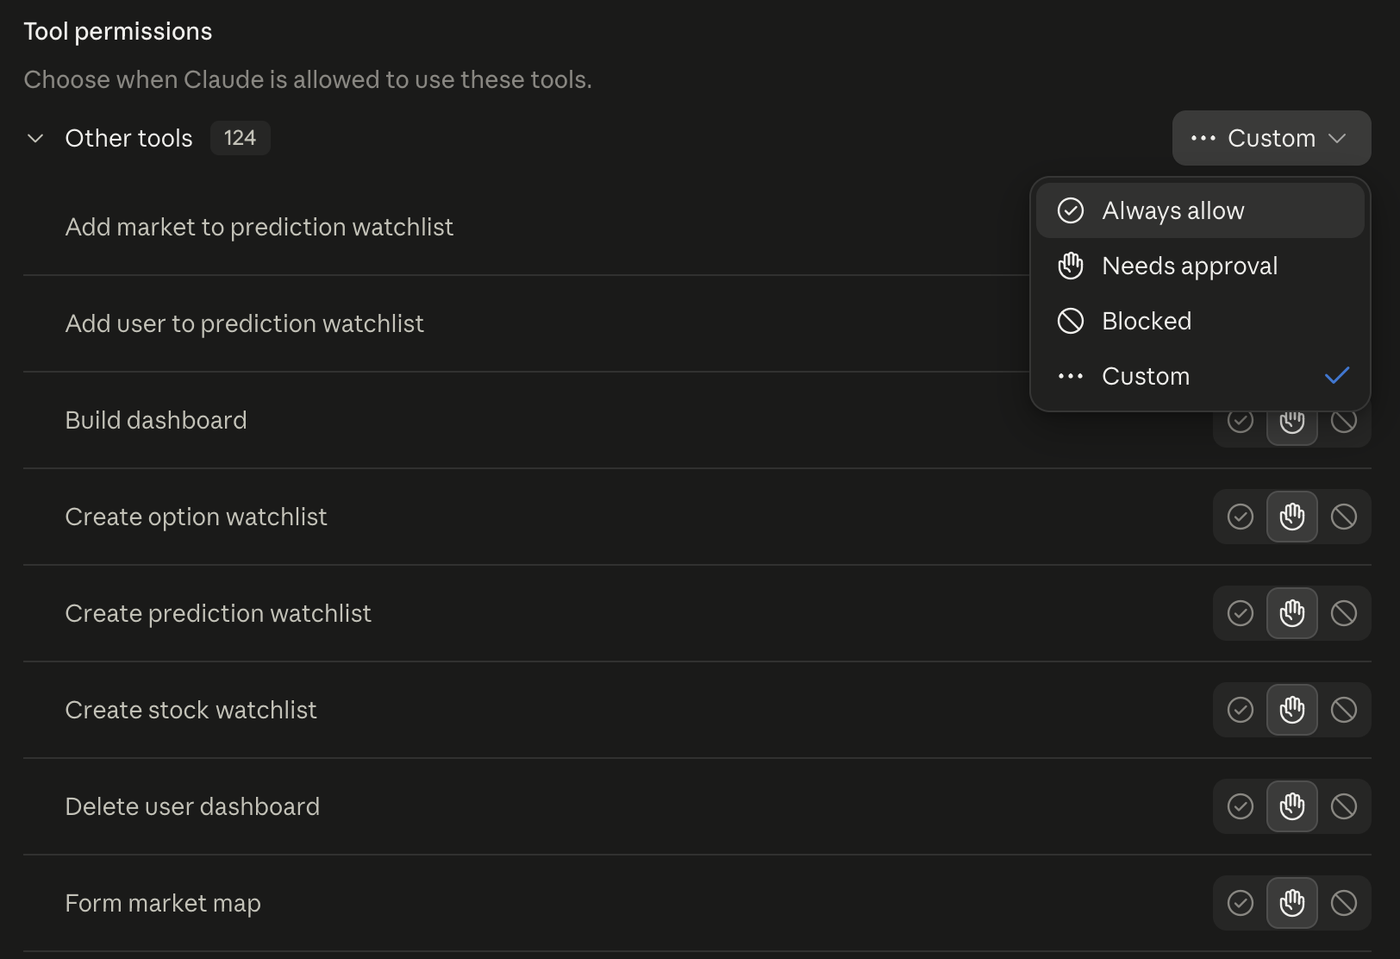
All 124 tools in one group, and one dropdown. Everything this project uses only reads market data. A handful of the 124 can write to your account, creating and deleting watchlists, and nothing here ever calls them. If you would rather keep those gated, pick Custom instead and leave the create and delete tools on Needs approval.
- 3
Start a Cowork task and connect a folder
Claude needs somewhere to put the file, and an ordinary chat cannot reach your disk. In the message box switch from Chat to Cowork, then pick Project or folder. Any empty folder works, a new one on your desktop called
dashboardsis fine.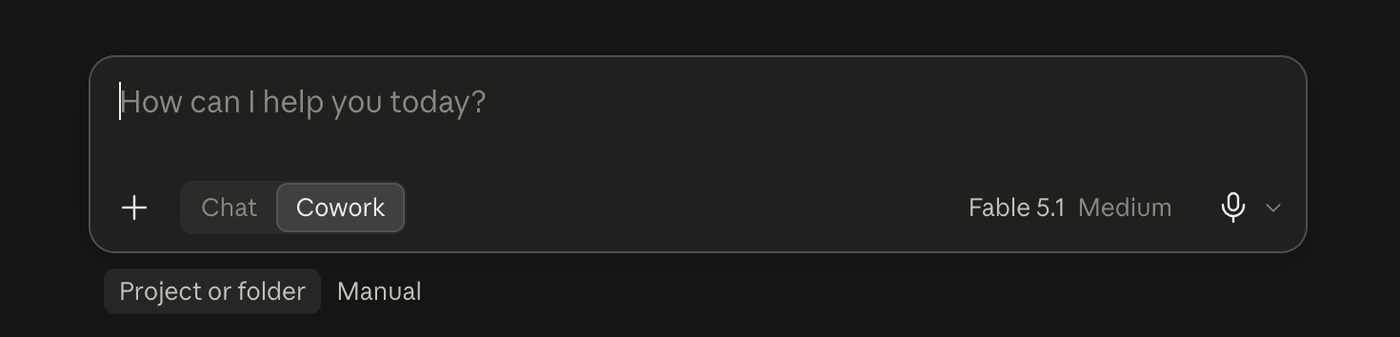
Cowork, then Project or folder. If your version of Claude has no Chat and Cowork toggle, it handles this automatically and there is nothing to switch.
- 4
Say what you want
Swap
NVDAfor anything. Claude reads the recipe and checks it has what it needs, then asks you one question before spending a single call.Paste into ClaudeRead https://unusualwhales.com/skills/uw-dashboard-skill.md and follow it to build me a positioning dashboard for NVDA in this folder. Walk me through anything you need from me.
Claude then asks which of the six subjects below you want, and builds only those. If the connector is not set up, the folder is not shared, or the symbol does not resolve, it stops and tells you which rather than failing halfway through.
Six subjects. Take all of them or take one.
Each one replaces a screen you would otherwise open separately, and each names the tools behind it so you can go and check the numbers yourself. The call cost is what that choice adds to the build.
- 01
Dealer positioning
3 callsThe levels strip across the top, then net gamma at every strike. Positive means dealers are long gamma and sell into strength. Negative means they chase the move instead. The strip and the bars are computed on different bases, so when they disagree the page shows you both rather than quietly reconciling them.
- get_gex_levels
- get_max_pain
- get_greek_exposure_by_strike
- 02
Option flow
3 callsPrice and cumulative directional delta flow on one shared time axis, plus call and put premium by expiry. Real dollars committed, in order, and which dates they are aimed at.
- get_ticker_candles_by_range
- get_greek_flow_by_ticker
- get_flow_per_expiry
- 03
Dark pool
2 callsWhere today's shares actually changed hands, off exchange versus lit, and a table of the largest blocks that printed.
- get_dark_pool_volume_price_group
- get_dark_pool_trades
- 04
Volatility
2 callsImplied volatility by days to expiry, out to 45 days. When a near expiry spikes above the rest, it names the scheduled event behind it, or says none was found.
- get_implied_volatility_term_structure
- get_market_events
- 05
Biggest contracts
1 callThe individual contracts carrying the most money today, with volume against open interest so you can see which ones look like new positions rather than closing ones.
- get_options_screener
- 06
How it compares
2 callsThe sector's most bullish and most bearish names by net premium, yours highlighted and the rest greyed, so you can see whether today is unusual for the company or for everyone.
- get_stock_screener, twice
Nothing here is a fixed menu either. Once the page exists you can ask for a panel that is not on this list, and the 124 tools on the connector are all fair game.
Now name a different company.
The recipe keeps the chart code and the data in separate files, so the next ticker costs one sentence and no new code.
Same dashboard for SPCX, reusing the template you just wrote.
What you actually have is an API and a template.
The dashboard above is not a product we shipped you. It is one pass through the recipe, using a handful of the 124 tools on the connector. The useful question is not whether you like it. It is what you would rather have, and how often you want it.
- Rung one
Change what is on it
Claude still has the data, the template and the connector in front of it, so changing the dashboard means describing the change. Each of these is a follow-up message.
Swap a panelDrop the term structure and put congressional trading in NVDA there instead.Change the windowMake the intraday panel 5 minute bars, covering the last three sessions.Add your own readFlag any strike where net gamma flipped sign since yesterday.Strip it backI only care about the top panel. Make that the whole page. - Rung two
Stop looking at one name at a time
A basket is data rather than code: four more names means four more data files and an index, not four more charting engines.
Paste into ClaudeNow do the same for AMD, MU, AVGO and TSM. One data file each, plus an index page linking to all five with ticker, last price and day change, sorted by the day's move. Tell me how many API calls that cost.
- Rung three
Take yourself out of the loop
A job that runs at 4:05 every afternoon cannot sit in a chat window waiting for you. Same key, same data, different door: the REST API.
Paste into ClaudeTake this out of the conversation. Write me a Python script that does what you just did without the connector: read UW_API_KEY from a .env file beside the script and call the Unusual Whales REST endpoints directly. Ticker list comes from a plain text file, one per line. Reuse the template. Write into a dated folder so yesterday's run survives. If a ticker fails, print why, skip it, keep going. Key stays in .env, out of the script, out of the HTML, and in .gitignore. Then tell me how to schedule it and what one full pass costs in API calls.
That
.envhabit is the same one the earnings volatility scanner uses, so a scheduled scanner and a scheduled dashboard become the same kind of thing running off one key.
All of this runs on an API key, and 7 days are free.
The connector, the 124 tools, the recipe, and everything you build after you stop following it. We are handing you an API and a template, not a finished product.
7-day free trial. A credit card is required to start. Cancel any time within the 7 days and you pay nothing; if you don't cancel, it converts to a paid API plan automatically.